求助大佬!
求大佬给一个VB函数示例。现在想用VB函数做一个模板在触摸屏上用
由于TP1200不支持C函数,我在WINCC中本人做了一个C函数的模板,具体如下:
//Show screen
SetPropertyByConstant("HOME","qushiwindow","Visible","True");
//screenWindow choose
ActivateScreenInScreenWindow ("HOME","qushiwindow","Usually");
//设置趋势窗口标题
SetPropertyByConstant ("Usually", "strTitle", "Text", Title);
//指示单位
SetPropertyByConstant ("Usually", "strTitle_1", "Text", Unit);
//设置趋势控件标题
//SetPropertyByConstant("Usually","qushiContrl","TrendWindowName",Name);
//取消自动小数点
SetPropertyByConstant("Usually","qushiContrl","ValueAxisAutoPrecisions","false");
//设置小数点
SetPropChar("Usually","qushiContrl","ValueAxisPrecisions",decimal);
//设置趋势颜色
SetPropertyByConstant("Usually","qushiContrl","TrendColor",Color);
//取消自动范围
SetPropertyByConstant("Usually","qushiContrl","ValueAxisAutoRange","false");
//设置数值轴上限
SetPropertyByConstant("Usually","qushiContrl","ValueAxisEndValue",Maximun);
//设置数值轴下限
SetPropertyByConstant("Usually","qushiContrl","ValueAxisBeginValue",Minimun);
//选择第一个趋势变量
SetPropChar("Usually","qushiContrl","TrendIndex",Parameter_Name);
//设置变量
SetPropChar("Usually","qushiContrl","TrendTagName",trendlog);
其中红色部分为自己建的char*类型参数,用于自己定义。
VB具体要求如下:
本人想用VB脚本做一个模板,目的是使用一个弹出画面,画面里有一个趋势视图,当点击不同的数据时,使用同一个弹出画面来显示对应的数据曲线。
比如现在有3个温度,温度的量程不一样,分别是0-10,0-50,0-100,分别有三个I/O域,当点击对应的IO域时,使用同一个弹出画面来显示曲线。
且脚本中需要可以设置:
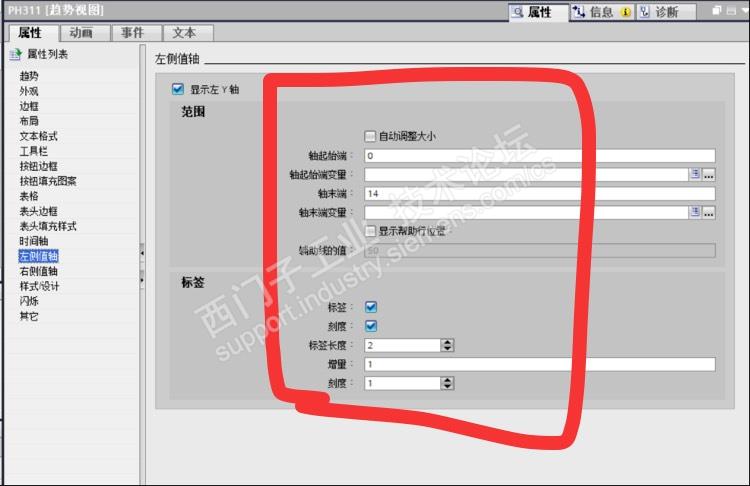
1.左右侧值轴显示的上下限,如0-10
2.左右侧值轴的标签长度和增量和刻度
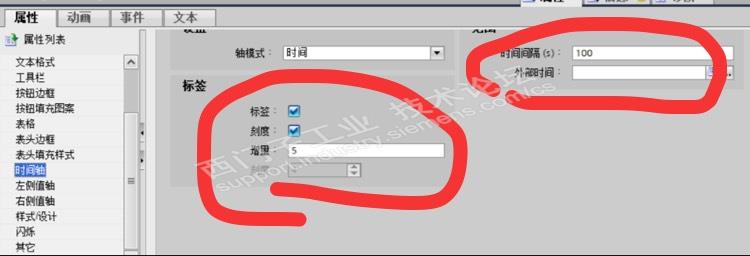
3.时间轴的时间间隔和增量
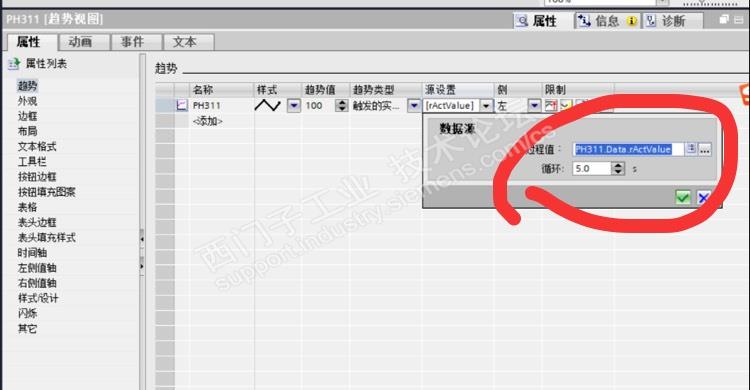
4.可以自己选择趋势的过程值和循环时间


 西门子商城
西门子商城 西门子中国
西门子中国


 钻石
钻石


 本版热门话题

 相关推荐
相关推荐 相关帖子推荐